Executive Summary
Many economists and policy analysts have promoted trade liberalization in rich countries as the most effective way to reduce
poverty in the developing world. Cline (2004), one of the leading references on this topic, projected that rich country trade
liberalization would lift 540 million people out of poverty. This paper analyzes and corrects this projection. It notes that:
1) Most of the people lifted out poverty in these projections have their incomes raised from just below the international
poverty level of $2 per day to just above this level. While this gain may correspond to a meaningful improvement in these
people's lives, most are not being advanced very far from an impoverished living standard, if at all.
2) The Cline projections are overstated by approximately 20 percent due to an error in calculation. Once this error is
corrected the projected reduction in poverty is just under 440 million.
3) The Cline projections rely on the use of the Gini coefficient as the basis for fitting the income distribution. This
is an arbitrary method that produces very poor fits in many instances - a point acknowledged in the book itself. It would
be equally legitimate to use the poverty rate to fit the distribution, a methodology that yields projections that are drastically
lower - trade liberalization reduces poverty by less than 80 million people.
4) The impact of trade liberalization is even less if we take into account expected economic growth. The full effects of
any agreement for trade liberalization will not be felt for a period of time. Trade barriers are typically phased out over
time, and economies take time to adjust to the new relative prices that will exist in a world of liberalized trade. Many developing
countries are projected to experience substantial growth between the period on which Cline based his projections and the point
at which the full benefits of trade liberalization will be felt. If Cline's methodology is applied to the income distribution
that is projected to be in place when the full effects of trade liberalization are realized than the impact on poverty reduction
from trade liberalization will be less than 20 percent of the impact projected by Cline.
5) Finally, it is important to note that in Cline's analysis about half of the gains from trade that are estimated to reduce
poverty come from the developing countries reducing their trade barriers; the other half are from rich countries' trade liberalization.
The gains that developing countries can get from reducing their own trade barriers should be treated separately, rather than
lumped together with gains from trade liberalization by rich countries, since developing countries can individually act to
liberalize their own trade at any time, without negotiating or reaching agreements with the developed countries.
While
any reduction in world poverty should be viewed as beneficial, trade liberalization is very likely to be accompanied by concessions
from developing countries. Some of these concessions, such as paying patent- and copyright-protected prices for many goods,
will impose substantial costs on developing countries. In addition, recent trade agreements have severely limited the ability
of developing countries to pursue the same sorts of policies that the rich countries used in order to industrialize. For these
reasons, it is important to have a clear idea of the size of the potential gains to developing countries from trade liberalization
- in order to determine if they exceed the costs.
Introduction
In recent years trade liberalization has been widely promoted as the best mechanism for eliminating poverty in the developing
world. This argument has been adopted by the World Bank and other international financial institutions, many prominent non-governmental
organizations, and numerous academic economists and development experts. It has also been actively promoted by the New York
Times and Washington Post editorial boards, as well as dozens of other prominent commentators and writers.
While there are certainly theoretical reasons for believing that trade liberalization can reduce world poverty, the predicted
benefits from liberalization are far smaller than the claims of proponents imply. Standard trade models do indicate that trade
liberalization will reduce poverty in the developing world, but the predicted reductions in poverty are swamped by the impact
of normal economic growth, and are at least an order of magnitude less than the impact of growth in countries that have successfully
industrialized, such as China. Of course any reduction in poverty is desirable, but since poor countries are being forced
to make concessions in exchange for trade liberalization in rich countries, it is important that they approach trade negotiations
with a clear assessment of the size of the potential benefits.
This paper examines the nature of the predicted reductions in world poverty from trade liberalization. The first section
describes the process through which trade liberalization is predicted to reduce poverty. It points out that the vast majority
of poverty reduction is assumed to result from raising people who were living on an income that is just below the international
poverty standard of $2 a day, to a standard of living that is just above $2 a day. The second section compares the extent
of poverty reduction predicted from trade liberalization with the poverty reduction over the next decade that would be predicted
based on World Bank growth projections. This discussion includes an examination and correction of the projections in Cline
(2004), one of the most cited works on the topic.
Escaping Poverty: What the Models Mean
The basic logic of the models linking trade liberalization in rich countries to poverty reduction in developing countries
is that the world price of some of the items produced in developing countries would rise, in the absence of rich country trade
barriers. In other words, if rich countries did not impose barriers that restricted imports of sugar, textiles, or other items
produced in developing countries, then rich countries would demand more of these items, driving up their price. Higher prices
for these products translate into higher incomes for producers in developing countries. Some of this gain goes to the factory
or farm owners in developing countries, but much of this increase in income is passed on to the factory or farm workers, many
of whom are among the world's poor. This income gain will typically mean higher wages for those who are already working and
also increased employment, as more workers are needed to meet the increase in demand.
While the logic on how rich country trade liberalization can lead to poverty reduction in developing countries is straightforward,
it is important to realize that in most cases the impact of liberalization will be limited. The rich countries already import
a substantial volume of goods from the developing world, and in most cases the remaining trade barriers are relatively small.
The average import-weighted tariff on goods from the developing world to major industrialized countries ranges from 3.93%
in the United States and 8.89% in the EU to 9.96% in Canada and 13.48% in Japan2. For example, if the U.S. completely eliminates a tariff on imported clothes of 5 percent, then the impact on the price
charged by exporters cannot possibly exceed 5 percent (U.S. consumers will not pay more for products after tariffs are eliminated)
and will typically be substantially less. Usually consumers will be the main beneficiaries of a tariff reduction, with most
of the gains from rich country tariff reductions taking the form of lower prices in rich countries. This can still lead to
a somewhat higher price for exporters in developing countries, but the gains will not usually be very large3.
A second feature concerning rich country trade liberalization is that it will not benefit all developing countries equally.
In some cases, developing countries benefit from existing trade restrictions in rich countries. This is due to the fact that
these trade restrictions raise prices in the rich countries above the world market price. Insofar as developing countries
are allowed to export into these markets, they are able to sell their products at higher prices than would be the case in
the absence of trade barriers. This is the case with sugar exports to the United States, for example. The United States provides
sugar quotas to countries in Central America and elsewhere that allow them to sell fixed amounts of sugar in the United States
at prices that are far above the world market level. If the United States eliminates this quota system, these countries would
be able to sell more sugar in the United States, but they would get a far lower price.
Similarly, the United States currently has a quota system for most textile and apparel imports (which is scheduled to be
eliminated at the end of 2004). This allows quota holders to sell a fixed volume of textiles and apparel at a price that exceeds
the world market price. With the elimination of these quotas, developing countries will be able to sell more textiles and
apparel to the United States, but at a lower price. Countries that currently have relatively large export quotas are likely
to lose in this scenario.
Another case of a loss from rich country trade liberalization stems from the removal of export subsidies. When rich countries
subsidize products that compete with producers in the developing world, this is a loss for those producers. The subsidies
lower the world market price and thereby reduce the income of producers in the developing world. However, insofar as developing
countries are also consumers of the subsidized products, the elimination of rich country subsidies will be a loss. For example,
if a developing country produces no cotton, then it is currently a beneficiary of rich country subsidies to cotton producers,
since it is able to buy cotton and cotton products at a lower price than would be the case if the subsidies were eliminated.
The same is true for subsidies to food crops. Many of the world's poorest countries are net importers of food, and therefore
benefit from rich countries' subsidies that drive down the price of these food crops.
Therefore, the removal of rich country export subsidies will have a mixed effect on the developing world. Countries that
export large volumes of products that are in direct competition with the subsidized items will gain from the elimination of
subsidies. But countries that produce relatively small amounts of the subsidized goods will be hurt by the elimination of
the rich country subsidies.
It is also important to note that in analyses such as Cline (2004) about half of the gains to developing countries from
trade that are estimated to reduce poverty come from the developing countries reducing their own trade barriers; the other
half are from rich countries' trade liberalization. In other studies the proportion that is due to developing countries reducing
their own barriers is even higher4. The gains that developing countries can get from reducing their own trade barriers should be treated separately, rather
than lumped together with gains from trade liberalization by rich countries, since developing countries can individually act
to liberalize their own trade at any time, without negotiating or reaching agreements with the developed countries.
This backdrop is helpful for understanding how trade liberalization is projected to lift the poor in the developing world
out of poverty. Essentially, it increases the price of their labor by an amount roughly proportional to the increase in the
products they produce. Since the projected rise in the price of the products is relatively limited (generally less than 10
percent), then the projected increase in income for the poor is also relatively limited. However, since most of the world's
poor are currently clustered close to the international poverty level of $2 a day, a relatively modest increase in income
is sufficient to lift many of these people out of poverty. For example, a 4 percent increase in the income of a person living
on $1.95 a day raises her income to 2.03 a day, three cents above the official poverty level. This is in fact the typical
situation of a person projected to be lifted out of poverty due to trade liberalization.
Table 1 shows the current median and mean incomes, by country, of the people projected to be raised out of poverty by trade
liberalization. It uses two methods for making this calculation. The first method fits the income distribution to the Gini
coefficient, following the methodology used in Cline (2004). The second method fits the income distribution to the poverty
rate. (For a full explanation of these methodologies and the construction of the table see the appendix.) It also shows their
mean and median incomes after trade liberalization.
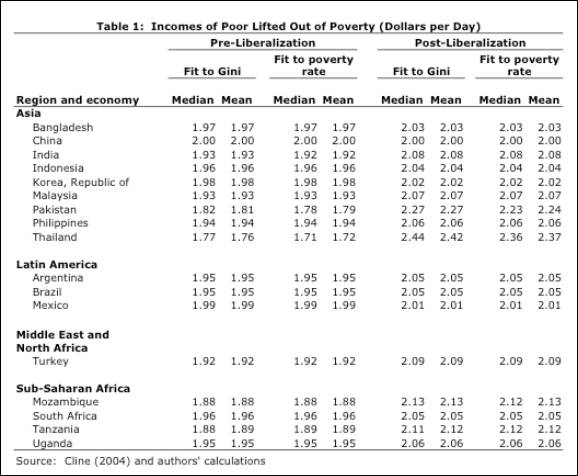
As can be seen, in most countries both the mean and median income of the people projected to be raised out of poverty as
a result of trade liberalization was already above $1.90 a day. This is true regardless of whether the Gini coefficient or
the poverty rate is used to calculate the income distribution. For example, both the mean and median income of the people
in India projected to be raised out of poverty is $1.93 per day using the Gini coefficient, or $1.92 per day using the poverty
rate. In Brazil, the mean and median income of those projected to be raised out of poverty is $1.95 per day, for both methods
of calculating the distribution.
The projected mean and median post-liberalization income level in almost every case is less than $2.10 per day. The projected
median and mean income after liberalization of the people in India projected to be lifted out of poverty is $2.08 per day.
In Brazil, those incomes are projected to be $2.05 per day.
There are two important points that should be clear from the projections in Table 1. First, and most importantly, the projected
gains from trade liberalization are not lifting impoverished people to living standards that anyone would view as very different
from poverty. They are raising people that had previously been slightly below the official poverty level to a standard of
living that is slightly above the official poverty level. This gain should not be minimized - in some cases it can mean the
difference between malnourishment and an adequate diet that allows a child to grow to be a healthy adult - but there should
be no illusions about the extent to which the typical person is projected to benefit in this process.
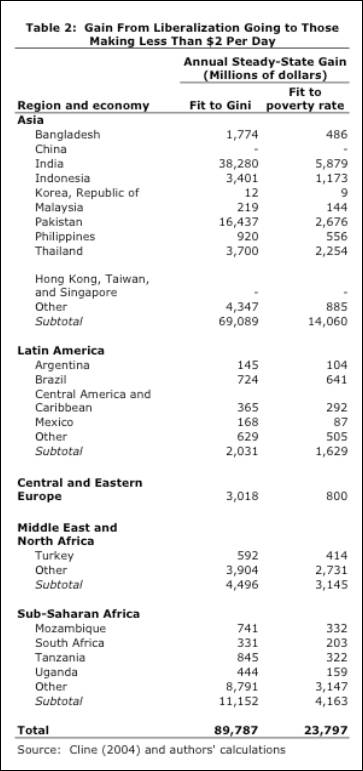
Second, the total amount of income being redistributed to people in poverty is relatively limited. This point is important
to note for two reasons. First, in principle the sums required to accomplish this sort of poverty reduction are not large.
The amount of income projected to be gained by the poor in developing countries due to trade liberalization is equal to between
0.1 and 0.4 percent of rich country GDP. While trade liberalization may be one way to bring about these gains to the poor,
it is not necessarily the only way. In principle, effective foreign aid equal to 0.1-0.4 percent of rich country GDP could
accomplish the same result. Table 2 shows the dollar amount of these gains from trade liberalization, when calculated (as
in Cline) by fitting the income distribution to the Gini coefficient, and also the much smaller figure derived from using
the poverty rate.
How Many People Benefit? - Getting the Numbers Right
There are several different issues that must be considered in projecting the number of people who are expected to escape
poverty as a result of rich country trade liberalization. First, Cline (2004), the leading work on this topic, overstated
the number of people who are projected to be raised above the poverty line due to trade liberalization, as a result of an
error in calculation. The corrected projections reduce the original projections by approximately 17 percent.
Second, the choice of the Gini coefficient as the basis for approximating the income distribution is arbitrary. A plausible
alternative, which in some cases produces a better fit, is the poverty rate. If the poverty rate is used to fit the income
distribution, then the implied rates of poverty reduction would be drastically lower - less than a fifth of the calculations
using the Gini coefficient.
The third issue is economic growth. The effects of trade liberalization are expected to be felt only over a substantial
period of time. This is due to the fact that trade barriers are usually phased out over time, and also that countries require
several years to adjust to the new trade regime before they can get all the benefits. The projections in Cline assume current
income levels; but the full benefits of trade liberalization are not likely to be felt for approximately 15 fifteen years,
even if agreements were reached immediately. It is therefore appropriate to examine the impact that trade liberalization will
have on poverty rates, given the projected patterns of income distribution in fifteen years. Each of these issues is addressed
in turn below.
The first point - correcting the mistake in the calculation - is straightforward. The projections in Cline (2004) depended
on estimates of the standard deviation of the log of the incomes within each country derived from the known Gini coefficients.
Unfortunately, Cline accidentally used the equation for the variance in place of the standard deviation5. Table 3 shows the number of people projected to be lifted out of poverty in each country in Cline (2004) and the number
that would be projected using the correct derivation of the relationship between the number of people in poverty and the Gini
coefficient.
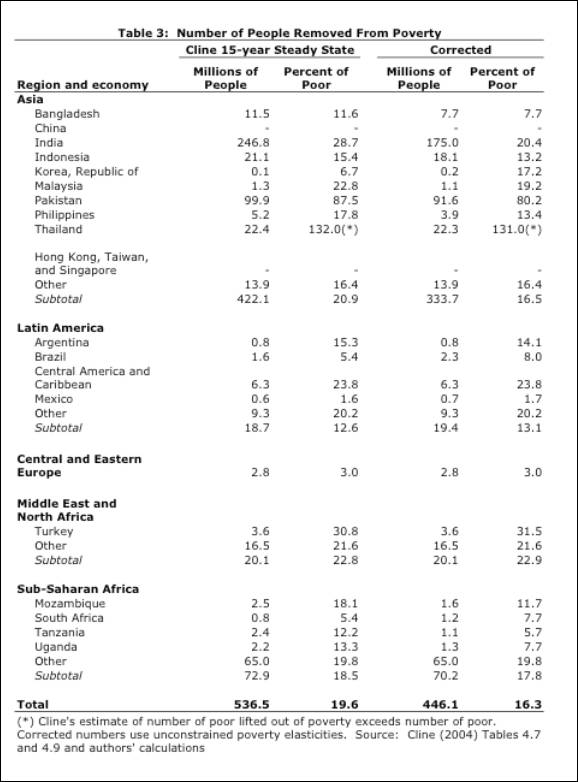
The second issue is somewhat technical, but it demonstrates the degree of uncertainty around the projections (even the
corrected projections) in Table 3. While it is reasonable to fit the income distribution using the Gini coefficient, in many
cases this fit is very poor. This point is explicitly acknowledged by Cline6. As a result of the poor fit, in many cases the number of people projected to be raised out of poverty is capped at
levels below what would be implied by the methodology, because the implied numbers are clearly implausible7. In some cases the uncorrected, uncapped projections exceed 100 percent of those currently below the poverty line and
in Thailand, even the corrected projection is for more than 130 percent of the poor to be lifted out of poverty. Another way
to fit the income distribution is to use the current poverty rate.
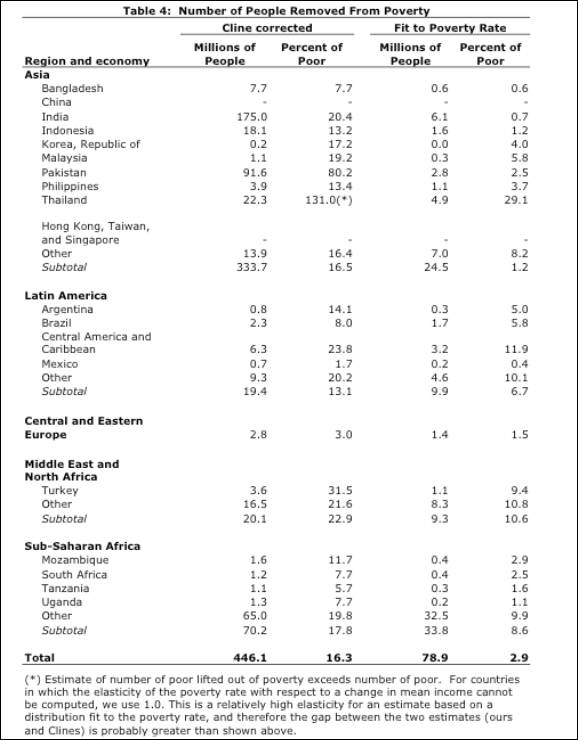
The number of people projected to be lifted out of poverty using this alternative methodology is shown in Table 4, along
with the projections using Cline's corrected method. The result of using the poverty rate to fit the income distribution is
that trade liberalization would have much less impact on world poverty than the projections in Cline (2004) imply, even after
correcting for the calculation error. For example, while the Cline methodology implies that trade liberalization would raise
175.0 million people in India above the poverty line, if the income distribution is fit to the poverty rate, then trade liberalization
would only lift 6.1 million people in India out of poverty. In Indonesia, the Cline methodology implies that trade liberalization
will lift 18.1 million people out of poverty, while the methodology that uses the poverty rate implies that only 1.6 million
people will be lifted out of poverty.
While it is likely that the methodology that relies on the poverty rate to fit the income distribution
understates the extent of poverty reduction from trade liberalization, it is also likely that using the Gini coefficient for
this fit overstates the extent of poverty reduction. Depending on the country, either method could give the better fit. However,
it should be clear that neither method is going to provide an accurate projection for all countries. Further research could
determine the best fit for each country and therefore provide a better projection of the country-specific poverty reduction
from trade liberalization, but it is likely that the projections in Cline (2004) are substantially overstated even after correcting
for the calculation error.
The final point - the impact of growth on poverty reduction - is probably the most important. Since there is inevitably
a long lag between the time when a trade agreement is negotiated and when its full benefits are realized, the basis for calculating
the impact on poverty should not be the current income distribution, but rather the income distribution that is projected
to be in place at the time that the agreement's effects are being felt. Past trade agreements have typically provided for
phase-outs of tariffs and quotas over five- to ten-year periods. It is reasonable to expect that any future trade agreements
will provide for a comparable phase out period. In addition, economies do not immediately adjust to the changes in prices
that result from the elimination of trade barriers. This adjustment process can also add to the delay before the full benefits
of a trade agreement are felt. In addition, Cline's original estimates were based on the income distribution that existed
in 1999. This means that developing country economies have experienced five years of growth in the intervening period.
Table 5 shows the numbers of people who are projected to be removed from poverty over fifteen years as a result of the
economic growth projected by World Bank. It also shows the number projected to be removed from poverty if this growth projection
is combined with the effects of trade liberalization. The last column shows the additional poverty reduction that results
from trade liberalization8.
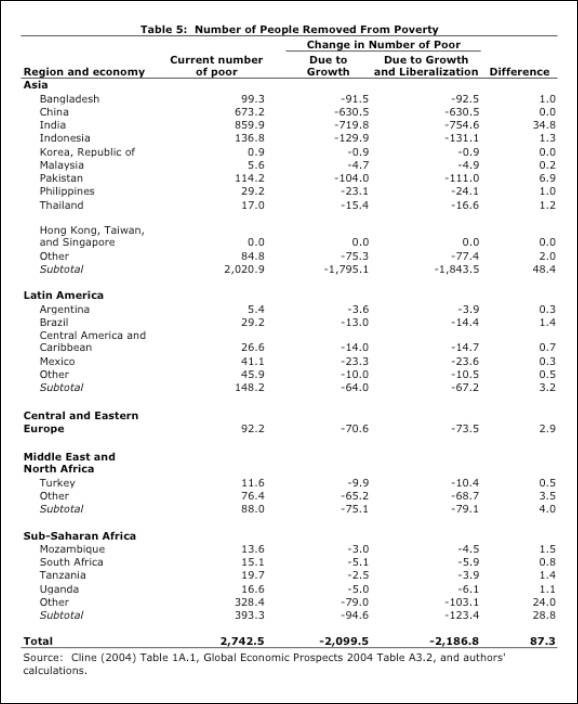
The projections in Table 5 show that the projected impact
of growth on poverty reduction is many times larger than the projected impact of trade liberalization. In other words, the
baseline growth path for developing countries will lead to much larger reductions in their poverty rates than will trade liberalization.
Furthermore, if countries actually follow their projected growth path, then the marginal impact of trade liberalization on
the number of poor people will be less than 20 percent of that shown by the projections in Cline. Of course, there is no guarantee
that developing countries will actually grow at the projected rate. For example, the International Monetary Fund has consistently
overestimated the growth rate for countries in Latin America9.
The good news in this story is that if developing countries can sustain normal growth over the next fifteen years, then
most of the world's poor will be raised above the poverty level - even though there will still be more than one billion people
in poverty. However, this would mean that the marginal impact of rich country trade liberalization on poverty rates is far
less than implied by a calculation based on the current distribution of income.
Conclusion
This paper has examined and explained projections of poverty reduction due to trade liberalization. It showed that the
projections in Cline (2004) substantially overstate the likely benefits for three reasons. First, a calculation error led
to an overstatement of approximately 17 percent in the number of people who would be lifted out of poverty using the book's
methodology correctly. Second, the methodology used in the book - fitting the income distribution using the Gini coefficient
- is arbitrary and often quite inaccurate. An equally plausible alternative methodology - fitting the income distribution
using the poverty rate - yields projections that are less than a fifth as large. A more accurate methodology would likely
produce projections that are between these two sets of projections. Third, it showed that the economic growth projected for
a period in which any trade liberalization process is likely to be implemented will have a substantial effect in reducing
poverty. If the effects of trade liberalization are calculated based on the income distribution that is projected after fifteen
years of growth, the impact of trade liberalization on poverty reduction is approximately 20 percent as large as the corrected
Cline projections based on the current distribution of income.
The paper also noted that the typical person raised above the poverty line in these projections is someone with an income
just below the international poverty level of $2 per day. Trade liberalization is projected to raise their income just above
this $2 per day poverty level. While this gain can mean a significant improvement in the life of the poor, most of the people
pulled above the $2 per day poverty line through trade liberalization would still be seen as impoverished.
Of course, even if the projected reductions in poverty from trade liberalization are not as large as many have been led
to believe, they still are not inconsequential. However, rich country trade liberalization is generally a quid pro quo for
concessions from developing countries. Many of these concessions, such as the enforcement of rich country patent and copyrights,
impose substantial costs on developing countries. In addition, trade agreements often limit the ability of developing countries
to pursue the same sort of industrial policies that rich countries used in order to develop. It is entirely possible that
the cost to developing countries from paying copyright- and patent-protected prices to rich countries will equal or exceed
the gains from rich country trade liberalization, as suggested by preliminary research on this topic by the World Bank10. If trade agreements simultaneously foreclose successful development paths for poor countries, then the world's poor
may end up being the big losers from commercial agreements that promise trade liberalization by rich countries.
Appendix
1
Cline's estimates on poverty reduction due to trade liberalization depend on an assumption of a lognormal income
distribution in each country. Normally, a particular lognormal distribution is described by the mean and standard deviation
of the log of the random variable-in this case, annual income. In Appendix 1B of his book, Cline correctly notes that the
distribution can equivalently be described by the mean (non-log) income and the standard deviation of the log income. While
the mean income is known for most countries, the standard deviation of the log income is not. Thus, Cline estimates the standard
deviation of the log income by fitting to the known Gini coefficient.
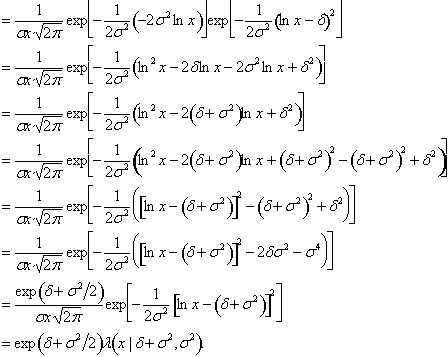
Unfortunately, the formula Cline uses to relate the Gini coefficient and the standard deviation is incorrect. Equation
(B.5) on page 53 is presented as:
However, the left hand side of this equation should be  , not
, not  . Thus, Cline accidentally substitutes the variance in place of the standard
deviation in all his calculations.
. Thus, Cline accidentally substitutes the variance in place of the standard
deviation in all his calculations.
The
remainder of this appendix derives the relationship between the Gini coefficient  and the standard deviation
  .
.
Let  be a lognormally distributed random variable. That is, let
  be normally distributed, i.e.,

Pulling a factor of  into the exponent and completing the square yields the following
Therefore, the first cumulative moment distribution is given by
The Lorenz curve relates the first cumulative moment distribution to the cumulative
distribution as seen in Figure 1.
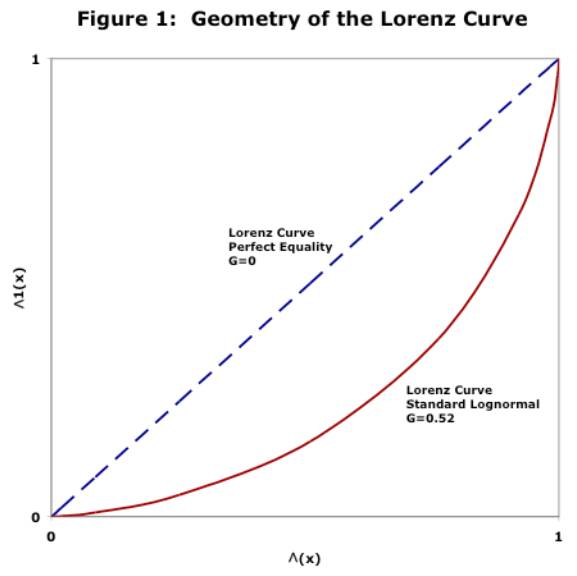
The Gini coefficient of inequality is the percentage of the area underneath the Lorenz curve of perfect
equality that is also above the Lorenz curve for a particular distribution.
The area under the lognormal Lorenz curveis
 . By virtue of the definition

Where  is an independent random variable lognormally distributed as
  . Because
  and
and  are independent normal variates,
  is distributed as:
Thus,

Where  is the standard normal cumulative distribution function.
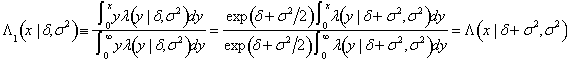
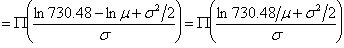
The Gini coefficient of inequality follows from area under the Lorenz curve
as
Finally, solving for the parameter 

Yields exactly equation B.5 on page 53 in Trade Policy and Global
Poverty11, except that the left-hand side is the variance, not the standard deviation of 
Appendix 2: Methodology
This steady-state analysis is based on data available in Tables 1A.1
and 4.9 of Cline (2004).
Income distributions are here always assumed to be lognormal. The mean  , and variance
  of the log of incomes for each country may be estimated differently depending
on the data at hand. For the Gini fit, the mean income,
of the log of incomes for each country may be estimated differently depending
on the data at hand. For the Gini fit, the mean income,  and the Gini coefficient of income inequality,
  were used to estimate the parameters as follows:
The variance,
 , may be calculated as in Appendix 1. Also from Appendix 1, we see that


Thus, 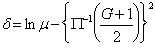 . Similarly, the parameters may be calculated from the mean income
  and the poverty rate,

Where the poverty level of two dollars a day corresponds to an income of $730.48 per year. Thus,  , where
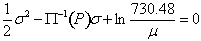
From the estimated parameters, the income distribution may be inferred.
In general, the Gini fit and the poverty rate fit are inconsistent, implying that the income distribution is not lognormal. Cline acknowledges that the Gini fit results in a poor predictor of the actual poverty
rate. Therefore, Cline estimates the number of poor raised out of poverty in
a country by first assuming a Gini fit to the lognormal distribution, modeling the percentage of poor lifted out, then multiplying
by the initial number of poor in the country. This process is clearly unnecessary
when employing a poverty rate fit.
There are two methods for computing the percentage of poor lifted out of poverty. Cline estimates the elasticity of poverty with respect to changes in the mean income
(assuming no change in distribution.) The derivation for this formula is in Appendix
1B (equation B.9) of Cline (2004).
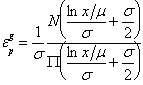
Multiplying the percent change in mean income by the elasticity yields the percent of the poor lifted out
of poverty. This procedure is unnecessarily complicated, as the poverty rate
may be determined directly from the income distribution. Suppose the mean income
 increases by a factor
  . Then the percentage of people below income
  before the change in the mean is given by
 . After the change in the mean, the percentage is
 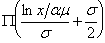 . The number of poor lifted out of poverty in a country of
  persons is simply
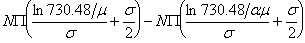
Regardless of the assumed distributional fit used, a person lifted out of poverty by trade liberalization
must have a pre-liberalization income of at least . That is, if trade liberalization is expected to raise incomes 10% (
 ) then all persons making less than $664.07 per year before liberalization will still be making less than $730.48 per
year after liberalization.
) then all persons making less than $664.07 per year before liberalization will still be making less than $730.48 per
year after liberalization.
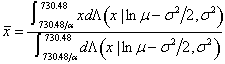
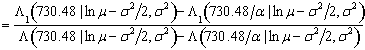
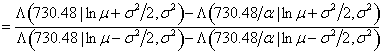
The median income of those lifted out of poverty is the income at the average of the pre-and post-liberalization
poverty rates. Therefore,
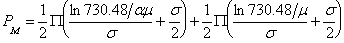
The median pre-liberalization income is then given by 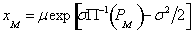 . The mean income of those lifted out of poverty may be computed directly
from the distribution as
. The mean income of those lifted out of poverty may be computed directly
from the distribution as
The post-liberalization median and mean are simply given by 
Where not directly available,
missing values were filled in by larger region averages weighted by the number of poor12.
Footnotes:
1. Mark Weisbrot and Dean Baker are economists and Co-Directors, and David Rosnick is a research associate, at the Center
for Economic and Policy Research.
2. Cline, Table 3.10, p.127.
3. The actual division of gains between consumers and producers will depend on the extent
to which consumer demand increases in response to a price reduction compared to how much producers increase supply when they
get a higher price.
4. See, e.g. World Bank, 2002. Global Economic Prospects and the Developing Countries 2002. Washington, D.C.: World
Bank, table 6.1.
5. See Appendix 1 for a detailed explanation of this error. Cline has acknowledged and corrected this error in his Technical
Correction, published at http://www.iie.com/publications/chapters_preview/379/errataiie3659.pdf.
6. Cline (2004) pp 35-38.
7. Cline constrains the elasticity of poverty with respect to the mean income to below 3.5. That is, the poverty headcount
decreases by no more than 3.5 percent for every percentage point increase in the mean income.
8. These calculations are derived directly from the cumulative probability density function for the income distribution, rather
than using elasticities of poverty with respect to income as in Cline, which avoids some of the problems in using the elasticities,
as described above and in Appendix 2.
9.See Baker, D. and D. Rosnick, 2003. "Too Sunny In Latin America? The IMF's Overly Optimistic Growth Projections and Their
Consequences." [http://www.cepr.net/IMF_Growth.htm]
10. World Bank, 2002. Global Economic Prospects and the Developing Countries 2002. Washington, D.C.: World Bank
11. William R. Cline. 2004. Trade Policy and Global Poverty. Washington, D.C.
12. For example, for Central America and Caribbean was not directly computed lacking a mean income for the grouping. Thus,
we substituted the average for the known Latin America countries.